How often does the best team win? Check out the stats!

Written by :
Matthew Hanssen

In football, the analysis of team performance goes beyond the results – victories and defeats; it is also a universe based on details and statistics. One of the questions we can ask is:
This concept of “favorite” is not based solely on popularity or history, but rather on teams that, according to statistical indicators, hold an advantage in a given confrontation.
To deepen our understanding and answer this question, we delved into an analysis that covered more than 22,000 matches over the past few years.
Google News
Want to stay up to date with everything that happens in the world of sports betting? Access the news from Aposta Legal Brasil!
Data analyzed
We studied a universe of 22,058 games played between January 2018 and September 2023.
These matches originate from 14 different top-flight leagues around the world, including Spain, England, Italy, Brazil, China, the USA and more.
In total, 388 different clubs appear in this analysis.
In our database, we collect information such as the final result of the match and the pre-odds of various bookmakers, which are essential for understanding the implied probability of a given outcome.
Understanding the odds
But after all, what are these odds?
In the betting world, odds are a reflection of the probability of a result happening and are basically the prices offered by bookmakers for each possible outcome of an event.
The odds value indicates the potential return for each unit bet. For example: an odd of 10 means that for every $1 bet, the return will be $10 (including the initial stake) if the prediction is correct.
Let’s take a game between Manchester City and Burnley as an example. Imagine that the odds offered are:
- Manchester City to win: 1.35
- Burnley to win: 9.02
- Draw: 5.35
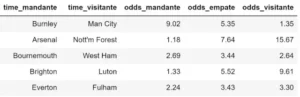
At first glance, these numbers represent how much you could win for each unit you bet if your guess is correct. Betting $1 on Burnley would give you a return of $9.02 if they win.
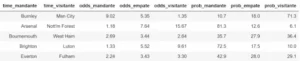
But what if we wanted to understand the probability implied by these odds?
The math is simple. Take the inverse of the odds to get the probability. For Burnley, it is 1 divided by 9.02, resulting in 0.1109 or 11.09%. This means that, according to the bookmaker, Burnley have an 11.09% chance of winning.
Repeating the process for Manchester City and the draw, we get probabilities of 74.07% and 18.69% respectively.
However, when we add these percentages together, we get something greater than 100% – specifically 103.85%. This is due to the bookmaker’s margin.
“When analyzing probabilities and outcomes, we see that the concept of “favorite” is not merely subjective, but quantifiable.” (Matheus Hanssen)
To get a more “pure” view of expectations, we need to redistribute these probabilities so that they total 100%. This can be done by adjusting each probability based on its proportion relative to the total sum.
For example, the adjusted probability of Burnley winning would be: (11.09 / 103.85) × 100 = 10.67%
Applying the same method to Manchester City and the draw, we get adjusted probabilities of 71.33% and 18.00% respectively.
Setting Favorites
When analyzing the distribution of probabilities between teams and how they are reflected in the results of matches, it becomes clear that the concept of “favorite” is not merely subjective, but quantifiable.
The relationship between odds and each team’s chances of winning reveals crucial details about expectations before a match. And to make this analysis more accurate and robust, we defined a criterion based on the difference in probabilities.
We will consider as a “favorite” the team that has an advantage of at least 5 percentage points over its opponent.
For example, in a scenario where team A has a 37% chance of winning and team B has a 33% chance, the difference is only 4 percentage points, so in this specific game, we do not identify a clear favorite.
If team A has a 40% chance against team B’s 30%, the difference jumps to 10 percentage points, identifying team A as the favorite of the match.
And how often do favorites win?
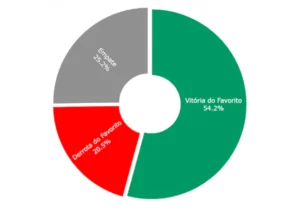
Of the matches in which a favorite was determined, 54.2% of the time the favorite emerged victorious.
Within the established parameters, we identified favorites in 19,596 of the 22,058 matches analyzed (89%). The most revealing data from this research is that, of these matches in which a favorite was determined, in 54.2% of the cases the favorite emerged victorious.
This number alone indicates that the odds, when reflecting probabilities, provide a fairly accurate, but not infallible, view of what to expect on the field.
Evidently, football, with its wealth of details and unpredictability, continues to be a sport where surprises happen and logic is sometimes challenged.
But let’s go a little further: are there differences depending on the country? And the answer is yes!
Looking at the graph below, we see an interesting spectrum of win rates, ranging from approximately 48% to almost 60%.
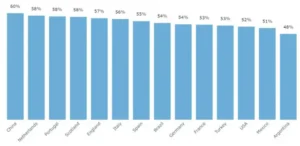
Most predictable leagues
China and the Netherlands top the table, indicating that in their respective leagues, the favourites generally live up to expectations and win more often. This could indicate a disparity in strength between the clubs in these leagues, with a few teams dominating.
Average predictability
Countries like England, Italy, Spain and Brazil are more balanced, where the favorites still win often, but there is also room for surprises. These leagues, being some of the most followed in the world, show that, even with big clubs and investments, the competition is fierce.
Most unpredictable leagues
Notably, Argentina stands out at the lower end of the table. In leagues like this, results can be less predictable, which could indicate a more level playing field between clubs or the influence of other factors outside the game.
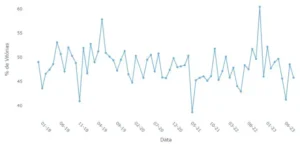
And over time? Considering an average monthly percentage of the favorite team’s victories over the almost six years of data, we can see a fluctuation in the performance of the teams considered favorites.
While at times they exceed expectations, at other times they fall short, showing no trend and remaining at an average close to 50%.
Finally, considering the dynamics and unpredictability of football matches, we can assess the extent to which pre-match odds align with actual outcomes. Remember the percentage point difference we calculated earlier?
In this view, each bar groups the matches with a certain range (for example 0-10% includes the matches where the favorite had a difference of 0 to 10 percentage points).
This difference in probability between teams provides an indication of how much of a favorite one team is over the other.
But does clear favoritism (or the lack thereof) actually translate into victories? Let’s analyze the data to understand this relationship.
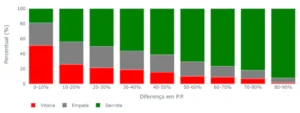 Photo: Freepik
The results obtained from the analysis provide a clear understanding of the relationship between the difference in probabilities of the favorite team winning and the actual results of the matches.
- 0-10% Difference: In this range, the difference in odds between the two teams is minimal, which implies that both have almost equal chances of winning. The result shows that the favorite loses 51% of the time, draws 30% of the time, and wins only 19% of the time. This indicates that when the difference in odds is low, the favorite team is more likely to lose than to win.
- 10-20% Difference: Here, the favorite has a slight advantage in terms of probability. The result confirms that the favorite wins more often (44%) than it loses (26%). However, there is still a considerable chance of a tie (30%).
- 20-90% Odds: As we move into larger odds ranges, we see a clear trend: the favorite team’s win percentage consistently increases, while the percentage of losses and draws decreases. For example, in the 80-90% range, the favorite wins an impressive 92% of the time, showing that when there is a large odds difference, the chance of the favorite team winning is very high.
Conclusion
So as the difference in odds between teams increases, the favored team is more likely to win.
This makes intuitive sense, as a larger difference in probability indicates a stronger belief that one team is superior to the other.
However, when the difference is small, the results are more unpredictable, and the favorite team has a greater chance of losing.
In short, this analysis reveals that the concept of “favorite” is more than a mere subjective label; it is a measure that can be quantified and based on probabilities.
We found that, within the established parameters, the favorites won in more than half of the matches analyzed, indicating that the odds offered by bookmakers reflect victory expectations relatively accurately.
However, football’s unpredictability persists, with surprises occurring in a significant proportion of games.