How do football match prediction algorithms work?

Written by :
Matthew Hanssen

Reviewed By :
Larissa Borges

Football, being the most popular sport in the world, attracts not only passionate fans but also data and statistics enthusiasts .
The complexity and unpredictability of the game make predicting results a challenging task. However, with the advancement of data science, statistics and technology, several models and algorithms have emerged that can help us decipher some of this unpredictability, often in a simple and efficient way.
See Also: How Often Does the Best Team Win? | See the Stats!
In this article, we will explore how algorithms can be used to predict the outcomes of football matches.
For this study, matches from the last two years of the Spanish championship were considered, totaling 799 games between 24 teams.
Google News
Want to stay up to date with everything that happens in the world of sports betting? Access the news from Aposta Legal Brasil!
Let’s start by visualizing the distribution of goals for home and away teams in our dataset.

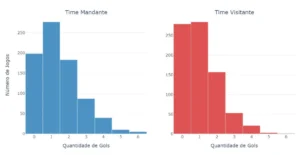
The graph above shows the distribution of goals scored by home teams (in blue) and away teams (in red). We can see that:
- Home teams tend to score more goals compared to away teams.
- Most games have between zero and two goals for both teams. One team scoring three goals or more becomes much rarer.
Poisson Distribution
Before we continue analyzing the data, let’s take a moment to contextualize a statistical concept: the Poisson distribution . It is used to estimate the chance of something happening a certain number of times in a specific period.
For example , it can help predict how many times a phone will ring in an hour or how many emails a company will receive in a day. It is useful when events are not likely to be frequent but may happen a few times in the observed period.
In short, it attempts to describe the probability of a certain number of events occurring in a fixed interval of time or space.
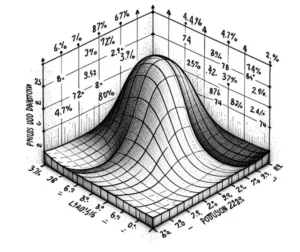
In the context of football, it can be used to model the number of goals a team can score in a match.
Let’s discuss how the Poisson distribution can be applied to model this goal distribution and how it can be used to predict match outcomes. The Poisson distribution formula is given by:
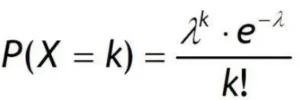
Where:
- P(X=k) is the probability of exactly k events (goals) occurring.
- lambda is the expected average number of events (goals).
- and is a constant, approximately equal to 2.7.
The basic idea is that by estimating the average number of goals a team scores in a match, we can use the Poisson distribution to calculate the probability of scoring any specific number of goals (0, 1, 2, 3, …).
This average, known as lambda, is fundamental to the Poisson distribution. A common approach to determining lambda is to calculate the average number of goals scored by a team over several previous games.
We will start by calculating the average number of goals scored by the home and away teams in our dataset. With these averages, we will use the Poisson distribution to predict the probability of scoring different numbers of goals.
In total, home teams scored 1,143 goals and away teams scored 869. Given that there were 799 matches, the home team’s average goal average was approximately 1.43, while away teams’ average was 1.08.
Using the calculated averages, we will visualize the Poisson distribution for the goals scored by the home team (blue) and away team (red). In practice, we use the formula mentioned above for each situation. For example, the probability of the home team scoring a goal can be given as follows:

The result of this calculation is close to 35%.
This will give us an idea of the probability of a team scoring a specific number of goals in a match. Performing this calculation for values between 0 and 6, we get the following distribution:
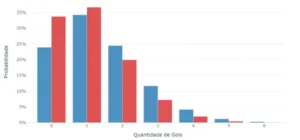
The difference in the “home factor” is noticeable. While visitors concentrate approximately 70% of the probability in the minimum values (0 and 1), the home teams have a greater distribution along the graph, with a much higher chance of scoring a greater number of goals.
Team strength
So far we have only made general calculations, but we need to be more specific. Although the probability of a visiting team scoring goals or winning a game tends to be small, it is very different when that team is Real Madrid or Alavés.
To do this, we enter into another concept: the strength of teams.
One of the most important factors when predicting the outcome of a football match is the relative strength of the two teams involved. The strength of a team can be determined by a number of factors, including its historical and recent performance, and the absence (or presence) of key players.
For simplicity, we will only consider the strength of a team based on their historical performance in our dataset at this point.
Let’s calculate each team’s offensive and defensive strength. A team’s offensive strength is the average number of goals it scores at home (for the home team) or away (for the away team) divided by its overall average number of goals scored at home or away. Defensive strength is calculated in a similar way, but using goals conceded instead of goals scored.
For example, as we have seen, the average number of goals scored by a club playing at home is 1.43. Barcelona, on the other hand, has an average of 1.95 goals scored at home. To calculate Barcelona’s offensive strength at Camp Nou, we simply divide the two averages:
Barcelona Home Attacking Strength = 1.95 / 1.43 = 1.36
We can conclude that, playing at home, the blue and maroon club scores a number of goals 36% above average. Performing this calculation for each of the teams, we arrive at the values in the table below.
| Team | Offensive Force (House) | Defensive Force (House) | Offensive Force (Out) | Defensive Strength (Outside) |
|---|---|---|---|---|
| Alaves | 0.73 | 1.05 | 0.61 | 1.53 |
| Almeria | 1.02 | 1.25 | 0.97 | 1.54 |
| Ath Bilbao | 0.96 | 0.85 | 0.94 | 0.80 |
| Ath Madrid | 1.38 | 0.75 | 1.56 | 0.79 |
| Barcelona | 1.36 | 0.54 | 1.57 | 0.66 |
| Betis | 1.07 | 0.92 | 1.20 | 0.80 |
| Cadiz | 0.73 | 1.10 | 0.64 | 1.06 |
| Celtic | 0.91 | 1.08 | 0.87 | 0.96 |
| Elche | 0.77 | 1.21 | 0.68 | 1.27 |
| Spanish | 0.96 | 1.31 | 0.97 | 1.25 |
| Getafe | 0.75 | 0.80 | 0.60 | 0.98 |
| Girona | 1.30 | 1.14 | 1.14 | 1.03 |
| Grenade | 0.83 | 1.44 | 1.14 | 1.33 |
| Las Palmas | 0.35 | 0.46 | 0.00 | 0.70 |
| raise | 1.03 | 1.45 | 1.11 | 1.69 |
| Mallorca | 0.73 | 0.87 | 0.78 | 1.28 |
| Osasuna | 0.73 | 1.17 | 0.85 | 0.82 |
| Real Madrid | 1.61 | 0.71 | 1.64 | 0.66 |
| Seville | 1.08 | 1.06 | 1.01 | 0.82 |
| Society | 0.84 | 0.67 | 1.16 | 0.84 |
| Valence | 0.96 | 1.03 | 0.90 | 1.00 |
| Valladolid | 0.77 | 1.21 | 0.58 | 1.40 |
| Vallecano | 0.97 | 1.20 | 0.76 | 1.02 |
| Villarreal | 1.40 | 0.97 | 1.10 | 0.77 |
Now that we have each team’s offensive and defensive strength, we can use these metrics to predict the expected number of goals each team will score in a match. The basic formula for calculating expected number of goals is:
Expected goals = Team’s offensive strength * Opposing team’s defensive strength * Overall goals average
Therefore, in the game between Real Madrid and Barcelona, taking place at the Santiago Bernabeu in Madrid:
- We expect Real Madrid to score 1.51 goals (1.61*0.66*1.43)
- We expect Barcelona to score 1.20 goals (1.57*0.71*1.08)
Even though these values clearly show who is the favorite to win the match, they still don’t tell us the chances of each team winning. So, let’s use the expected goals and all the learning we’ve learned so far to finally enter the last step of our work.
Calculating the probabilities of the match outcome
Assuming we want to calculate the probability of the final result of El Clasico being 1-1, we can use the values we just found and input them into the Poisson formula. First, we calculate the probability of Real Madrid scoring a goal:

Then we do the same calculation for Barcelona:

Finally, as we want to find the probability that these two events occur at the same time (Real Madrid and Barcelona scoring a goal), we must multiply the values, arriving at approximately 12%.
By performing this calculation iteratively, we can visualize each possible result in a matrix:
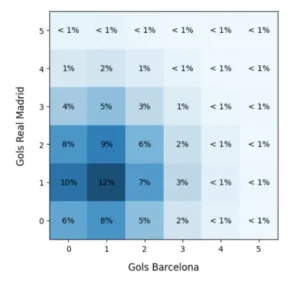
Now that we can calculate the probability of specific outcomes, we can also calculate the three possible match scenarios: Real Madrid win (by adding the probabilities when the home team’s number of goals is higher), draw (by adding the diagonal probabilities) and Barcelona win probability (by adding the remaining values).

Conclusion and possible improvements
Although the Poisson distribution, as exemplified in this article, is a good method for modeling the probability of events in a given interval, such as the number of goals in a football match, it does not capture all the complexity and dynamics of the sport, and other variables must also be taken into account in a more accurate model:
- Recent Team Form : A team’s recent performance is an indicator of its confidence and current ability. In our example, the result of a match two years ago is given the same weight as a match this month. There are methods for doing this weighting and that is a topic for a whole article.
- Injuries and Suspensions : The loss of a key player, whether through injury or suspension, can destabilize a team’s strategy and diminish its effectiveness on the field. Key players often play important tactical roles, and their absence can require a significant restructuring of the team’s formation and approach.
- Head to Head History : Football is also a psychological game. Some teams tend to have an emotional advantage over others due to previous victories or a long streak of games without defeat against a specific opponent.
- Importance for each team : Depending on the situation of the teams at the time of the match, the interest of each of them can have a big influence on the result. If one of the teams is fighting for the title or against relegation, the emotional factor can boost the potential of each player. On the other hand, if there is an important game in another competition a few days later, one of the teams may choose to rest its key players.
Football is a complex sport and many factors can influence the outcome of a match. Therefore, to improve the accuracy of predictions, we can consider additional factors already highlighted. In addition, more advanced techniques such as machine learning models can be used to capture the complexity and nuances of the game.
